ERIC KUNSMAN
Felicific Calculus: Technology as a Social Marker of Race, Class, & Economics in Rochester, NY
New York, United States • erickunsman.com


-
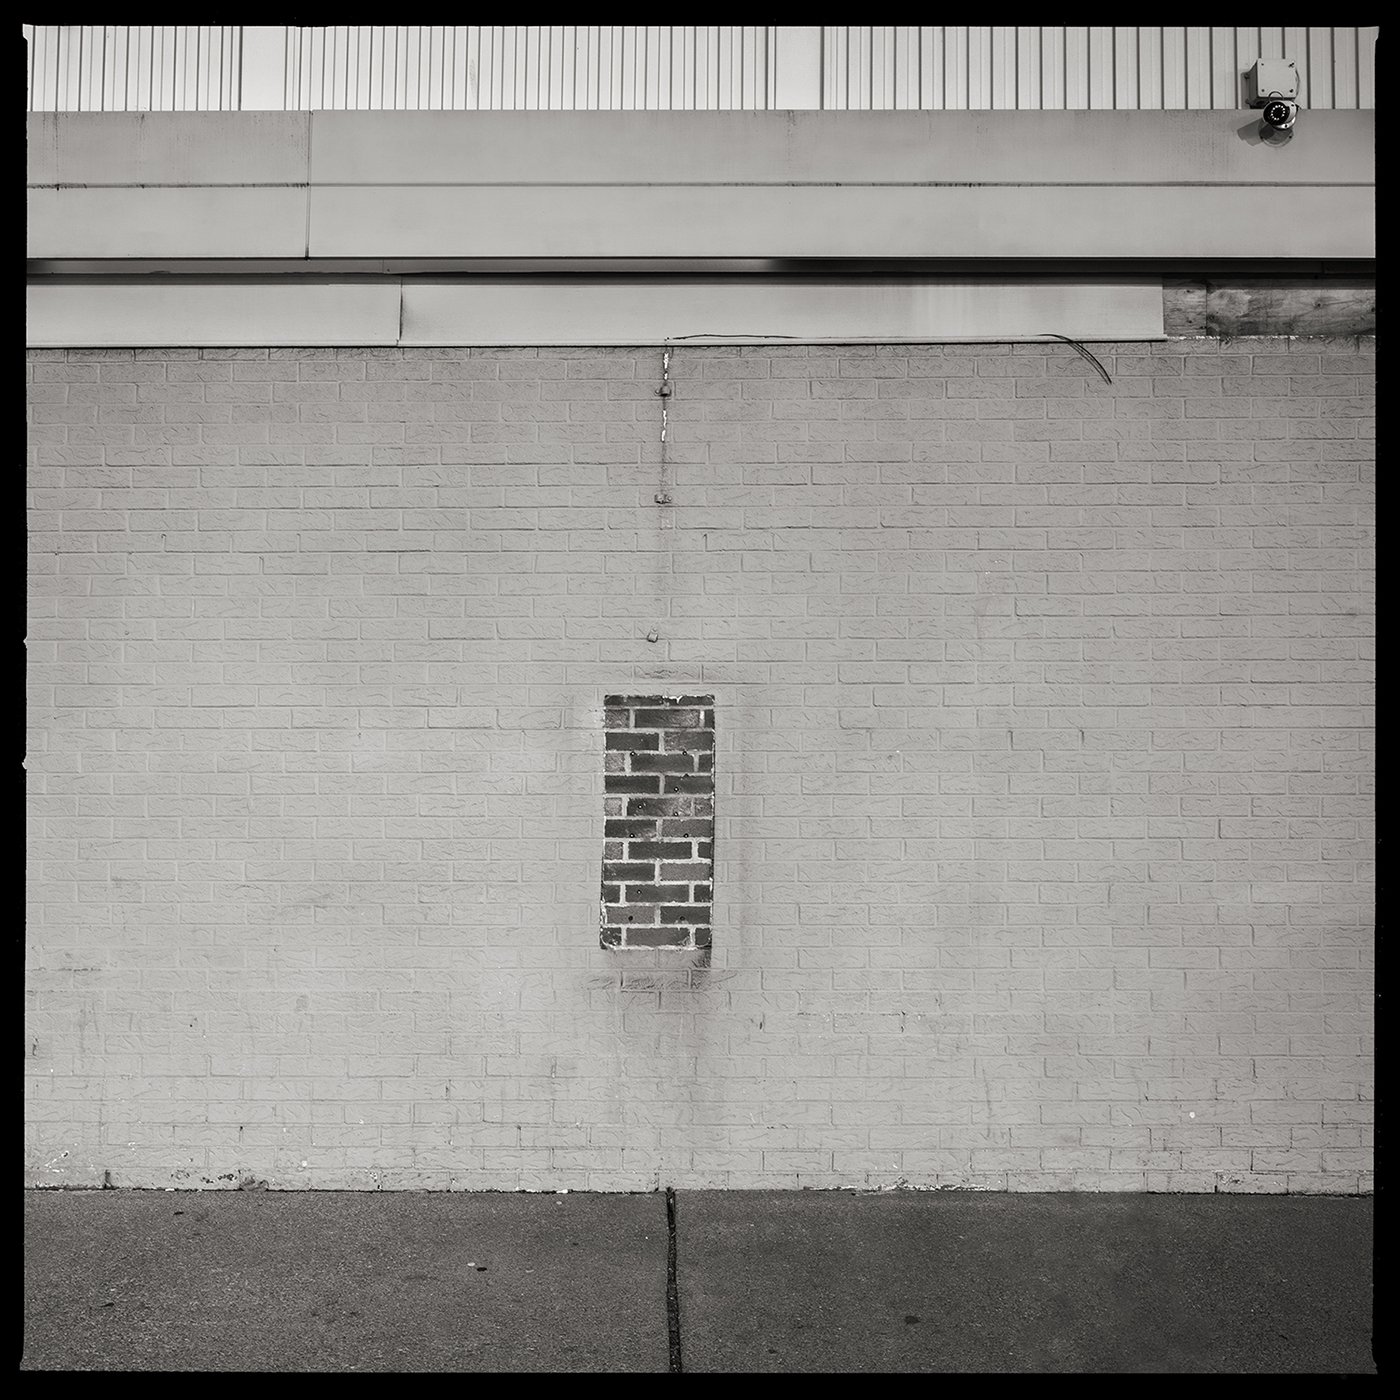
Rochester, NY, has 1,455 payphones, which serve as a felicific calculus by Frontier Communications regarding the decision to leave the payphones. Frontier is losing money from these payphones but continues maintaining them for one of the poorest cities by the number of people under the United States' poverty level.
To many individuals, these payphones serve as a social marker or social indicator, and to others, they serve as a marker of crime. Such social markers often conclude the perception that one area is worse than another, leading to biased decisions by policymakers.
That perception drove me to educate myself on what led to their perceived notions of a place they had never visited. What became apparent was the direct correlation between the poverty level and the payphone locations through looking at census maps and the payphone locations. The average income for these areas is under $20,000 per family.
To illustrate the socioeconomics of the area, interactive maps with payphone locations on transparent film overlaid on top of maps with census information; economics, race, housing income, and more. Each census map is standalone, creating a dialog for the information presented; the viewer must interact with the maps by lifting the top layer revealing the census key.
I also learned that many individuals still rely on payphones as their lifeline in Rochester. To tell their story, audio recordings from interviews with those individuals about their reliance on the payphones. Within galleries, three payphones are installed, allowing people to dial a phone number and listen to stories of those individuals so easily labeled and forgotten about.
To help viewers understand the notion of their bias and use of social markers, I invite the community to photograph a predetermined social marker in the county of each exhibition. Each participant provides the cross-streets of the photograph to map those locations. A closing discussion examines the relationships of how often the social marker is photographed compared to that communities census data.